

Windward, the wind-farm project this account's other write-up covers, ended with a small forecasting module for Spain's day-ahead electricity price — added mostly to prove the data source worked. It did more than that. Once I actually sat down to think about what to build with an accurate day-ahead price signal, the honest answer wasn't "sell electricity" — that's a heavily regulated business (comercializadora status in Spain needs legal, technical and financial capacity requirements, plus guarantees posted with REE and OMIE) with thin technical differentiation. The more interesting, more buildable thing is the software layer underneath it: forecasting, optimization, and honest backtesting, the kind of platform a real trading desk, a small producer, or eventually an independent aggregator would actually use.
So energy-trader is that software layer, phase by phase, starting from the smallest real slice: pull real market data, forecast the price, test two hypotheses about what else might improve that forecast, build a proper backtesting discipline, and then optimize a battery schedule against the result. Two of those five steps produced negative results. I kept them.
flowchart TD
    OMIE["OMIE\nday-ahead price"] --> DB[("TimescaleDB")]
    REE["REE REData\ndemand + generation"] --> DB
    DB --> FEAT["Feature engineering\ncalendar + price lags"]
    FEAT --> MODEL["GradientBoostingRegressor\nMLflow-tracked"]
    MODEL --> FCTABLE[("forecasts table")]
    FCTABLE --> OPT["Battery optimizer\nlinear program, PuLP/CBC"]
    OPT --> SCHED["Charge/discharge\nschedule"]
    FCTABLE --> API["FastAPI"]
    SCHED --> API
    API --> DASH["Dashboard"]
The data, and a timezone bug worth mentioning
Two real, public, no-auth data sources: OMIE's day-ahead price (the same feed used for Windward's price module, semicolon-delimited daily files, 15-minute periods) and REE's REData API for national demand and daily wind/solar generation. Both land in TimescaleDB — the first new piece of infrastructure this account has stood up specifically because the data volume justified it (hypertables, not because it's fashionable).
The bug: OMIE's collector stores timestamps as naive local wall-clock values in a timestamptz column — internally consistent for lag/period-of-day math (which only ever compares OMIE timestamps to each other), but not a real UTC instant. REE's demand data, by contrast, is stored as genuinely correct UTC. Joining the two naively skews by Spain's current UTC offset — two hours in summer CEST, one in winter CET. Caught by testing the join on a specific known row rather than assuming it worked, which is the only way this class of bug ever gets caught.
Two negative results, kept in the repo
The obvious next move once national demand is sitting in the database is to try it as a price feature — electricity demand and price are clearly related. I did, and the first version looked great.
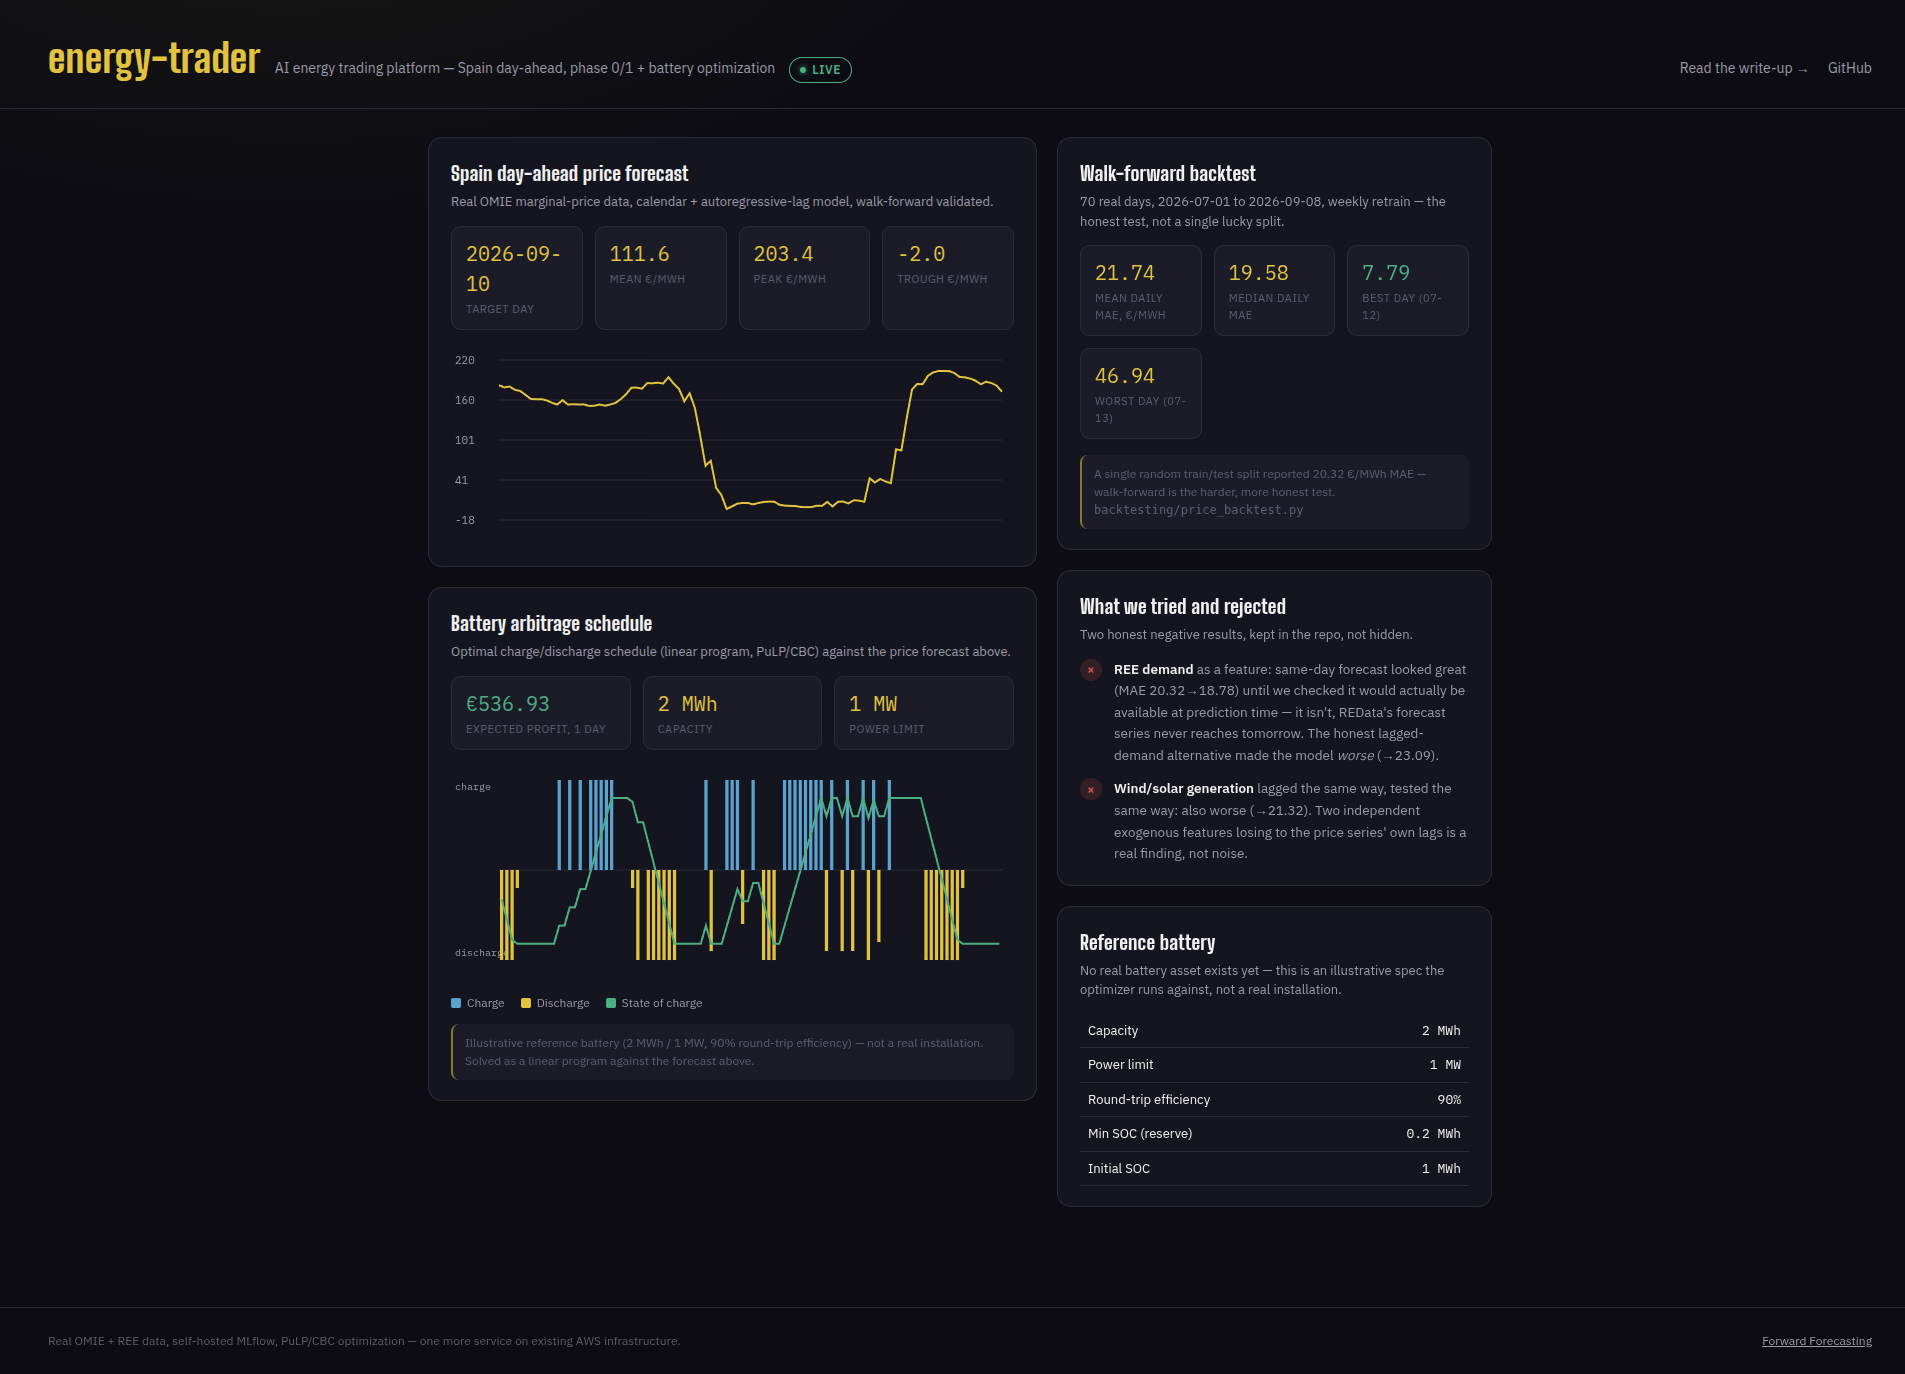
Same-day REE demand forecast as a feature: MAE dropped from 20.32 to 18.78 EUR/MWh. Then I checked whether that feature would actually exist at real prediction time. It doesn't — REData's own demand-forecast series only ever covers the current day, confirmed by requesting it for a future date and getting nothing back. Training on it would have meant training on a feature that's unavailable exactly when you'd need it: tomorrow. That's look-ahead bias, caught before it shipped rather than after — the entire reason this project's backtesting discipline exists.
The honest fix is a lagged feature — yesterday's demand, last week's demand, a rolling mean — always available by construction, no leakage possible. I rebuilt it that way and re-tested.
Lagged realized demand: made the model worse, not better — MAE 20.66 → 23.09 EUR/MWh. Renewable generation seemed like a better bet in theory (wind/solar oversupply is the actual mechanism behind Spain's near-zero and negative price hours), so I tested that too, same lagged-only discipline, same held-out methodology. Also worse: 20.32 → 21.32.
Two independent exogenous signals, tested the same rigorous way, both losing to the price series' own autoregressive lags. That's not noise — it's a real finding about this model. The price series already implicitly encodes recent supply/demand balance, at finer granularity than a day-level demand or generation figure can add. A genuinely new signal — a real day-ahead generation forecast rather than lagged actuals, which needs REE's separate, token-gated e·sios API — is a more promising place to look next than another lagged view of the same dynamics.
Walk-forward, not a lucky split
The single train/test split that produced that 20.32 EUR/MWh MAE number is a common way to report a model's accuracy, and it's also a soft form of cheating: it's one fixed slice of history, and a slightly-too-favorable window inflates the number without anyone noticing. The honest test simulates actually running the model — for each day in a real historical window, retrain only on data strictly before that day, predict, and score against what actually happened, having never seen it.
70 real days, 2026-07-01 to 2026-09-08, retraining weekly rather than daily (a runtime simplification, not a correctness one — each retrain still only ever sees data before the day it's used on). The walk-forward number, 21.74, is worse than the single split's 20.32. That's the whole point: the single split was mildly lucky, and walk-forward is what would have actually happened running this live.
A battery that doesn't exist yet
No real battery asset exists in this account — battery_state stays an empty table in the schema until one does. But a price forecast without something to act on is just a chart, so the optimizer runs against a clearly-labeled reference spec: 2 MWh capacity, 1 MW power limit, 90% round-trip efficiency, the kind of small commercial BESS this platform would eventually serve. Every surface that shows it — the API, the dashboard — says so explicitly.
sum(discharge × price × dt − charge × price × dt) subject to power and state-of-charge limits. No binary variables needed: charging and discharging simultaneously is never profitable once you account for the 10% efficiency loss, so a pure LP relaxation already avoids it without help.
Run against a real September day's OMIE prices (range 24.8–238.7 EUR/MWh), it charges at an average price of 88.5 EUR/MWh and discharges at an average of 215.1 EUR/MWh — real, sane arbitrage behavior, not a toy example. Expected profit for that one day, on a 2 MWh battery: about €540.
The stack, briefly
What it costs to run
Same EC2 as windward — one more pair of Docker containers (API + TimescaleDB) on infrastructure already running. One real, small deployment gotcha: the box already runs job-hunter-suite's own Postgres on port 5433, so this one's database landed on 5434 instead. The API container uses host networking, the same fix windward needed to reach the self-hosted MLflow server — a bridge-networked container's 127.0.0.1 is its own loopback, not the host's, and this project needed to reach both MLflow and its own Postgres that way.
Data collection runs on a systemd timer, once daily at 14:00 UTC (after OMIE's day-ahead auction result publishes), not a manual step anymore.
Try it
The live dashboard shows the real price forecast, the real battery arbitrage schedule solved against it, the walk-forward backtest summary, and both negative results — nothing hidden behind a "coming soon."
See it live
Real OMIE prices, a real linear program, two real negative results — not a slide deck.
Open energy.forwardforecasting.eu/app →About the cover image: the price chart literally becomes the bolt striking the battery — the whole pipeline this project builds, from a real OMIE price series into a schedule for a battery-arbitrage optimizer that, as the post above says, doesn't have a real battery to optimize yet. ImageModelstability.stable-image-core-v1:1 · AWS Bedrock (us-west-2)Prompt“Editorial illustration of a glowing gold lightning bolt built from stacked candlestick price-chart bars, deep navy background, a faint dashed gold outline of a battery shape floating behind it suggesting something not yet built, minimalist flat vector illustration style, no text, no logos”